Orbit Analytics
A concept for an AI-assisted analytics workspace: live metrics, natural-language questions over your data, and forecasts that explain themselves.
Overview
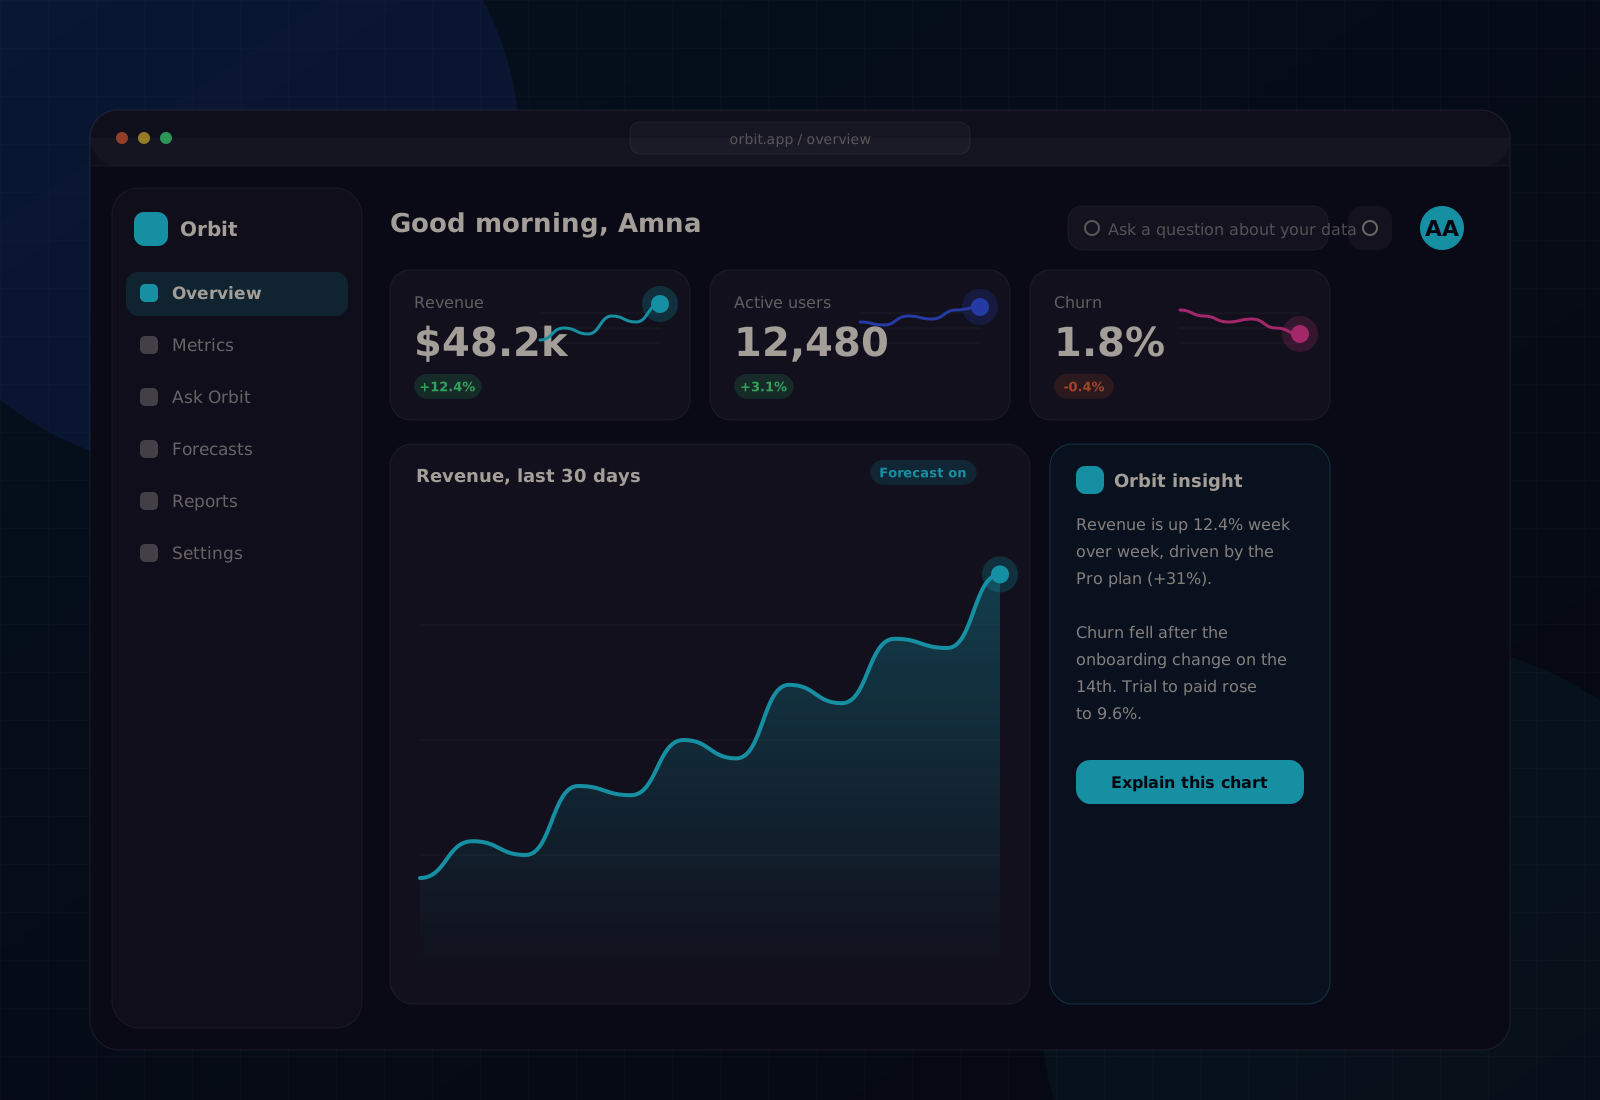
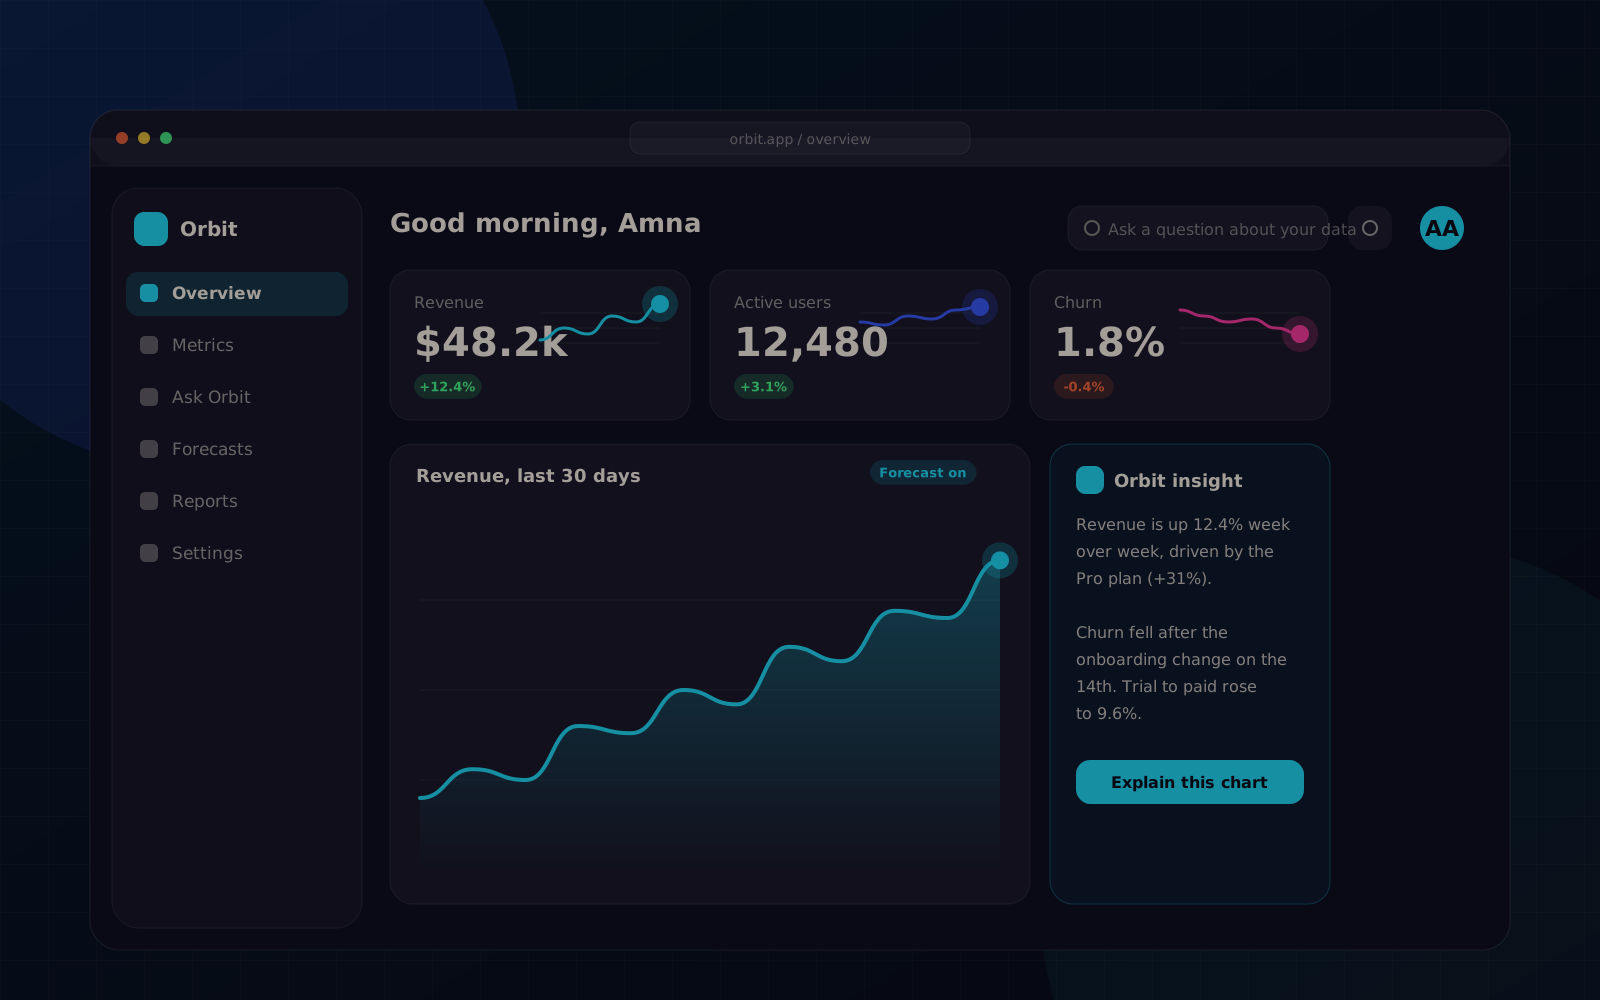
Orbit is a design and engineering concept for the analytics tool I would want to use every morning. Instead of a wall of charts, it opens with three numbers that changed, a chart for each, and a short written explanation generated from the underlying data.
Challenge
Analytics dashboards fail when they show everything at once. The concept had to surface only what moved, let people ask follow-up questions in plain English, and stay honest about uncertainty in any forecast it draws.
Process
- 01
Started from the questions a founder asks each morning and designed one screen per question instead of one screen per metric.
- 02
Built the KPI, chart and insight components as a small design system with a shared motion language.
- 03
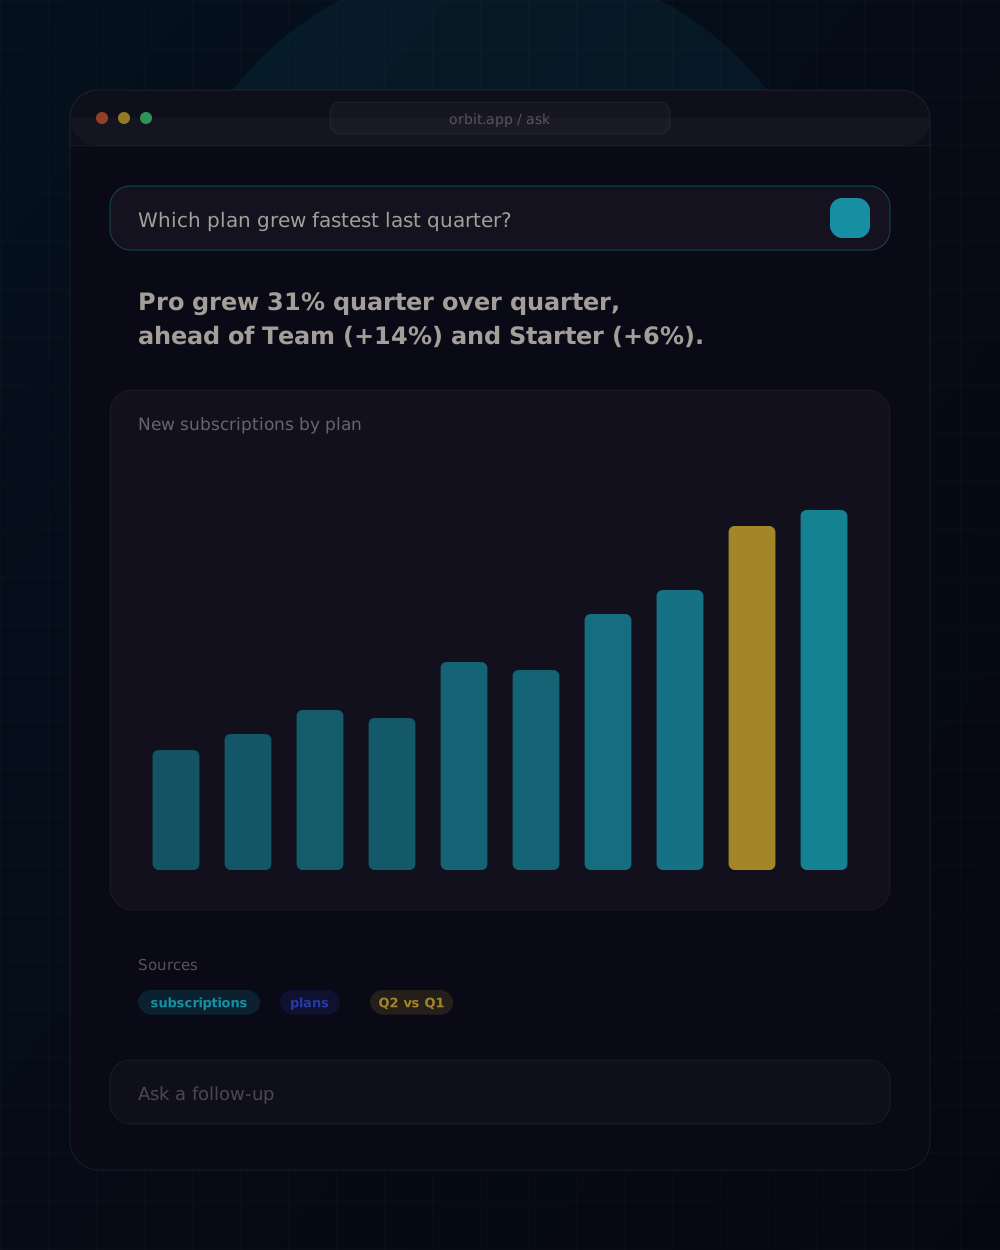
Prototyped the natural-language query bar against a sample dataset and tuned the prompt until answers cited the exact series they used.
- 04
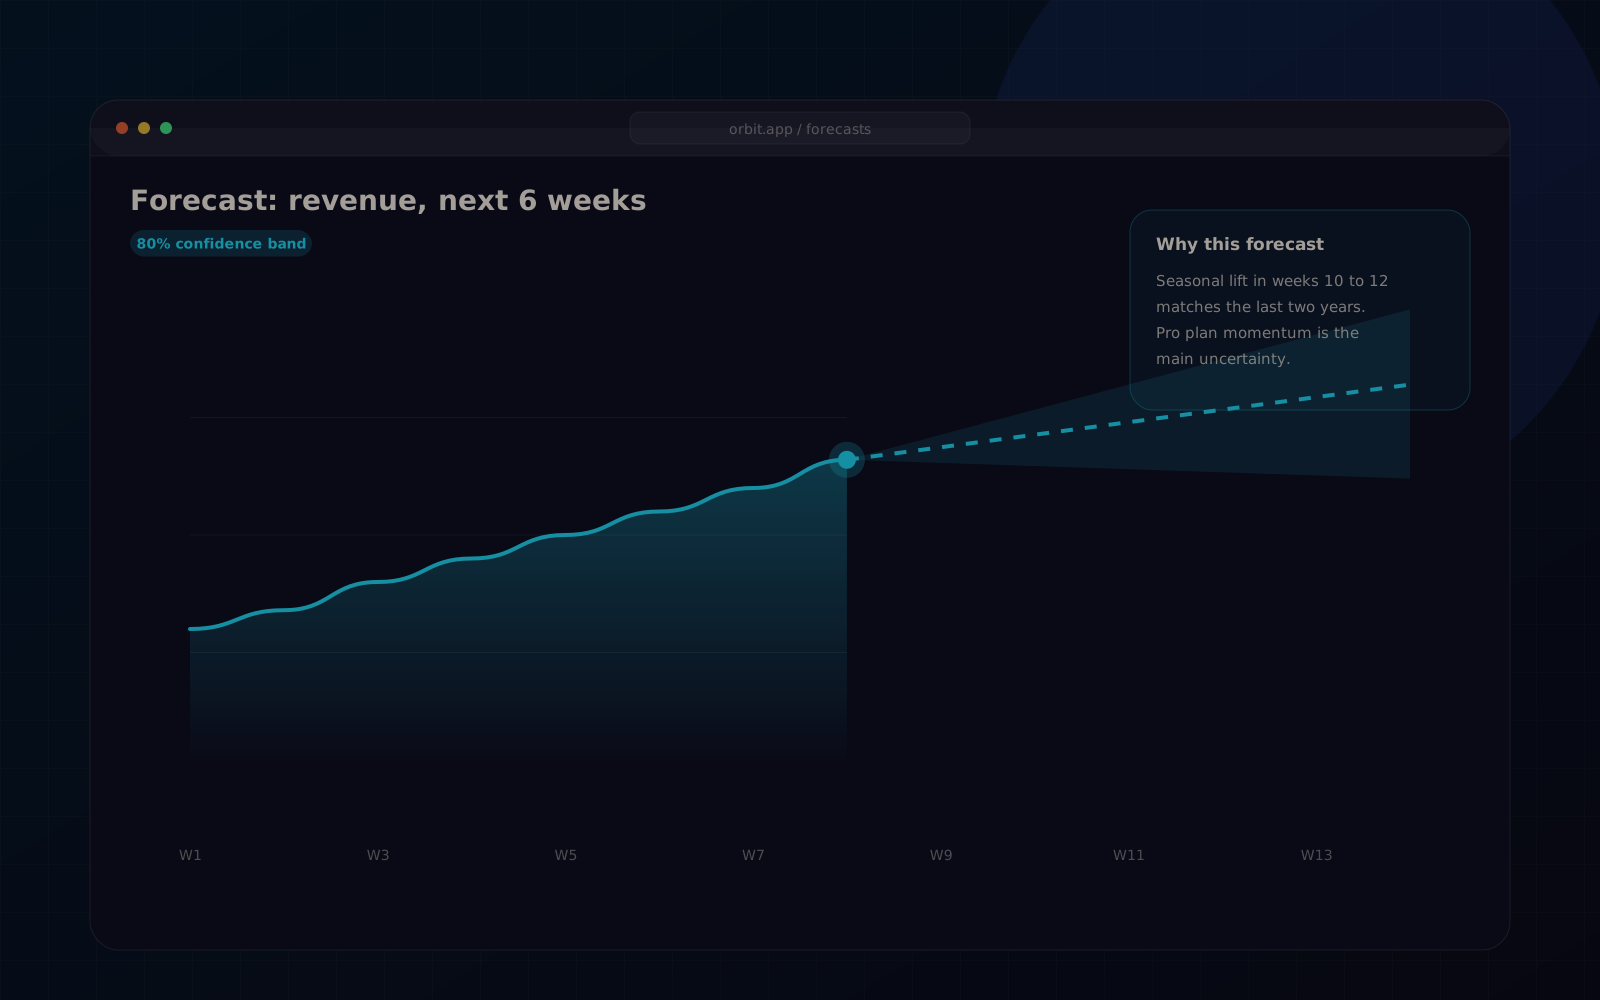
Added forecast bands with confidence shading so projections never read as facts.
Solution
A Next.js front end with a component library for metrics, charts and insight cards. Questions typed into the query bar are translated to SQL over a sample warehouse, the result is charted, and a short explanation is generated with the numbers attached.
Features
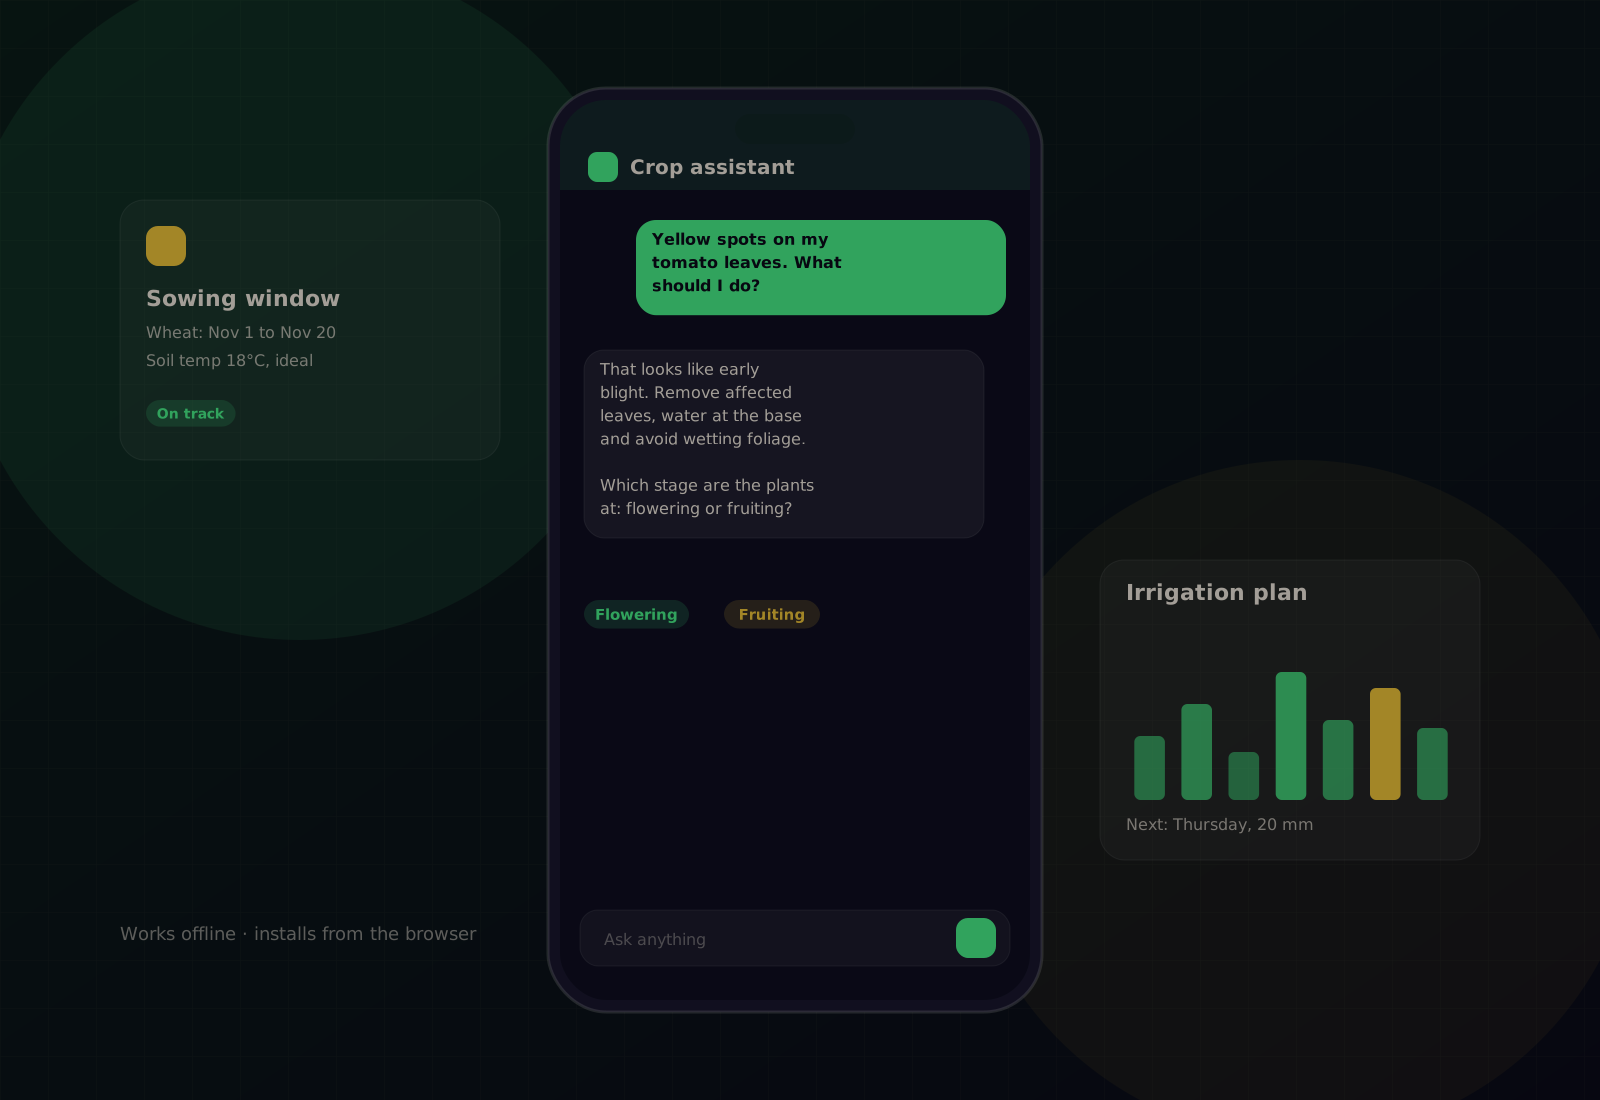
AI Agricultural Assistant
A conversational assistant that gives farmers practical, crop-specific guidance, recommendations and information through a simple chat interface.
Open case study